Comparing 2015 to 2014 in terms of BOTOX growth
I don’t have December yet, but comparing Jan-November, I am lucky to be able to present a 149% change from last year in our Modesto BOTOX usage. I like to make reports for the Botox company, so they can see how the team is doing. I welcome the representatives and Allergan managers as part of my Surgical Artistry team and I want them to feel good about their efforts. I appreciate them very much for all the help they have given me and my patients. Just having fun with an old spreadsheet (2003 Excel – and I use a flip phone with no text messaging).
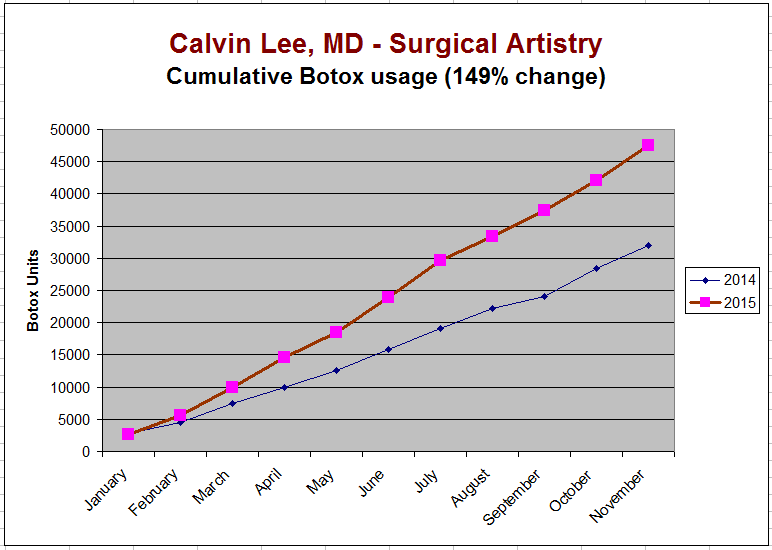
Above graph shows the cumulative monthly Botox usage and compares 2015 to 2014. I am missing the month of December because it isn’t over yet. But I think it shows a nice trend – and it shows a 149% change (or a 49% growth in the usage of Botox). I have other Botox statistics from previous posts – be sure to check those if there is any interest under the “Botox Statistics” category section. And there is also another Botox blog besides this one which I sort-of stopped updating recently. In that blog I have this valuable Botox statistics report for 2014.
And the hard Botox data:
I think sometimes this is called running totals. So if I look at March’s Botox data – that means the total amount of Botox I used from the beginning of the year to March.
| Cumulative data | ||
| 2014 | 2015 | |
| January | 2798 | 2701 |
| February | 4576 | 5562 |
| March | 7401 | 9983 |
| April | 9881 | 14621 |
| May | 12592 | 18513 |
| June | 15803 | 23864 |
| July | 19133 | 29629 |
| August | 22207 | 33390 |
| September | 24130 | 37377 |
| October | 28374 | 42088 |
| November | 31925 | 47509 |
About My Botox use in 2014
I felt very proud of 2014’s usage of Botox and at times felt that it couldn’t be any better. But 2015 proved that we can continue to improve!