| 12/14/20 – 11/16/21 |
| Data Entry by Dr. Tammy Wu and Jean |

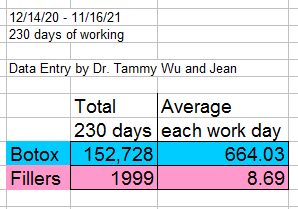
This graphic above is a spreadsheet depicting the amount of Botox units that I injected between 12/14/20-11/16/21. There are 230 injecting days for me between those dates. It’s almost one entire year of injecting. I’m missing a month, but perhaps I’ll get to it in a few weeks.
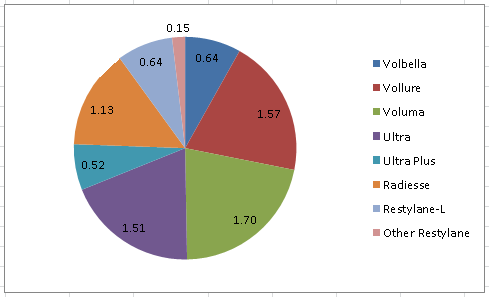
Take home messages for myself: Continue to prepare 8 bottles of Botox per day which is my norm. But perhaps I could increase it to 9 bottles per day. And fillers, I have another graphic which is a pie chart that reveals each different type of fillers used. Voluma has been the most popular filler used. The data shows approximately how much of each filler I would use on average for each day worked:

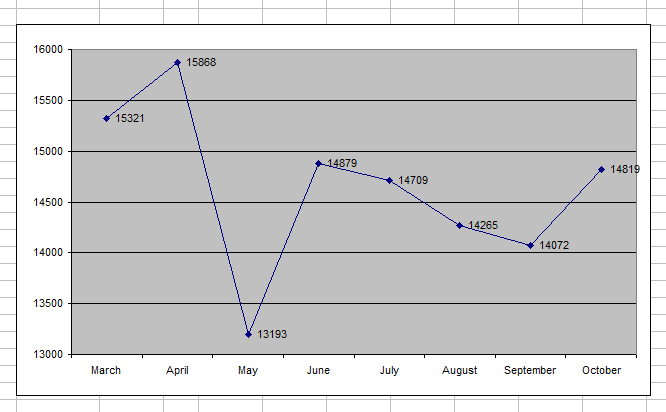
Below is a graph of the amounts of Botox in Units injected each month depicted in 2021. In a few days I should have November’s Botox data.


