Quarterly comparison of BOTOX usage by Calvin Lee, MD

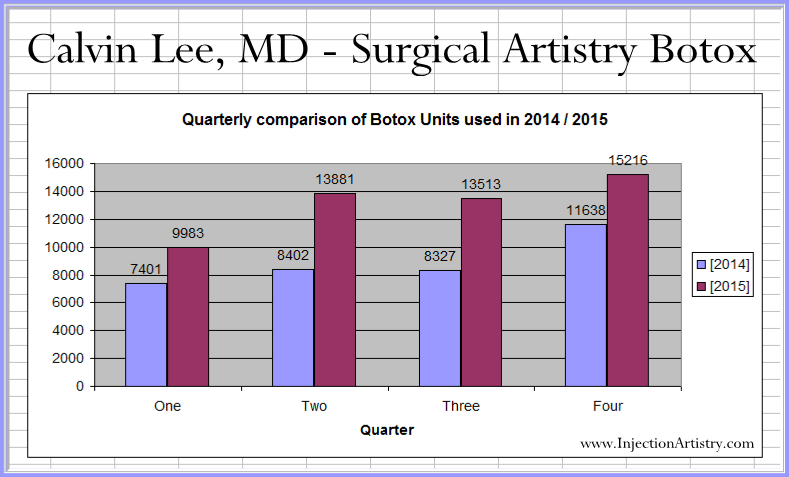
Reflecting upon my own childhood, I think there is an importance regarding summer jobs for kids. I have a life-long enjoyment of working with spreadsheets. My first summer job, which my father gave me at Ciba Geigy (a drug company), involved spreadsheets – using Lotus 1-2-3, I fell in love with the macro programming features, and I remember using spreadsheet programming to make a “pong” type game. I think I was in middle school at the time. I made graphs which were even more sophisticated than what I’m doing now. Anyway, this is today’s spreadsheet data work. I have a ton of numbers and it’s my job to create a way to explain the numbers in a meaningful way. I have numbers that come from each unit of botox used each day at work. And here I can show to my Botox friends that Botox is used the least in Quarter 1, then followed by a Quarter 3. Those are the “relaxed” Botox Quarters of the year. I also like drawing in regression lines, but that will be for another day. I’ve had my spreadsheet fix for today.

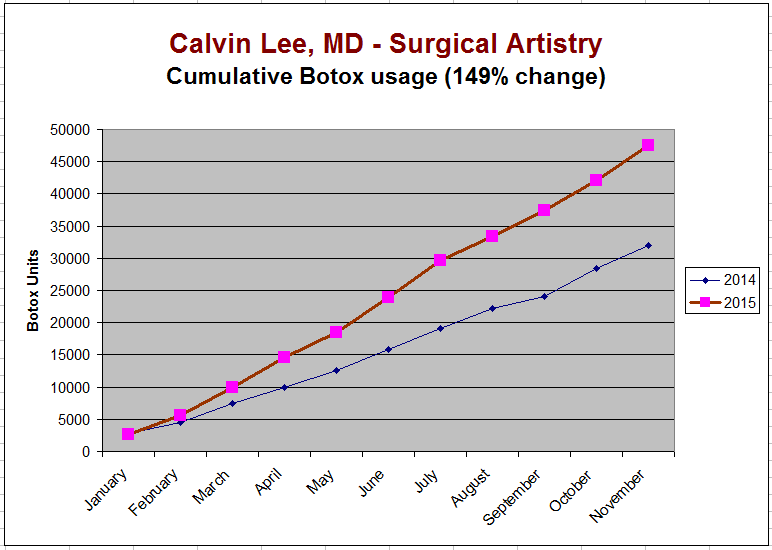
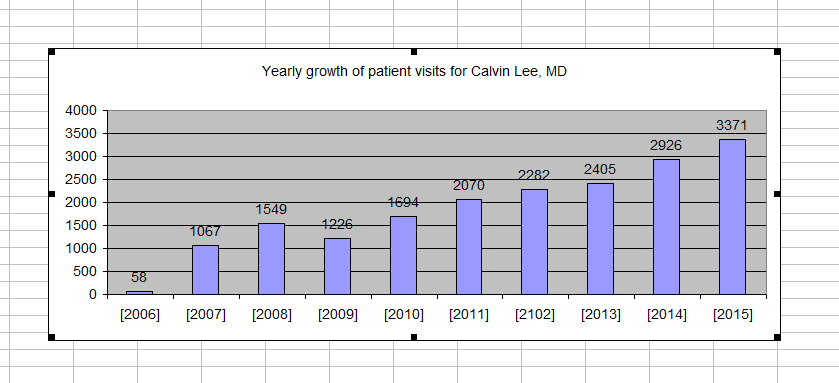
In my quest for quality work, I like to study patterns. For me it is always quality over quantity. I don’t like to sacrifice quality for the sake of doing more Botox. But I think the side effect of quality work is that there will be growth.

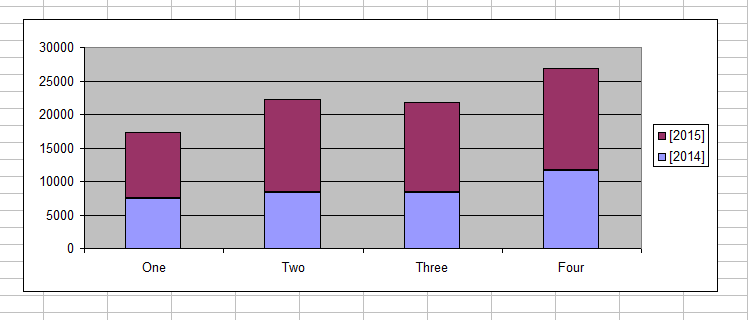
Quarters 2 and 4 are the strongest quarters for Botox use. Quarters 1 and 3 are weaker with Quarter 1 being the weakest. I’m not entirely sure of the pattern maybe someone can offer me suggestions. It may have something to do with the weather, school cycles, vacation schedules, wedding/reunion deadlines. I’m not sure – or perhaps even with my own scheduling habits. But in the past 2 years, I’ve tried to work as much as possible. I think in the future, I can do a study of “density” of Botox: normalize Botox use per day worked. Ahhh… so much you can do with data.

I have an obsession with spreadsheets, so my wife says. I just have a ton of data and I’m just massaging that data into more meaningful expression. I’m still in the pursuit of higher quality not quantity as some of these graphics suggest. But I’ll see growth as a side effect of successfully upholding the highest values relating to quality.

quarterly comparison of botox units 2014-2015 - with frame

stacked bar

Cosmetic Annual Growth by patient visits

Acupuncture, Botox, Juvederm, vein annual growth for Calvin Lee, MD

I am very thankful and proud. In 2006, I reinvented myself from General/Trauma surgeon to Acupuncture/Cosmetic Surgeon. In the operating room, I have been assisting in Tummy Tucks, Face-Lifts & breast surgeries done by my wife, THE Plastic Surgeon for the past 10 yrs. This graph shows the growth of what I do OUTSIDE the operating room, in our SURGICAL ARTISTRY office: Acupuncture & Cosmetic Injections. I use hundreds of needles per day. I started my practice with only 58 office visits in 2006. Last year I exploded to 3371 visits with one of the highest retention rates of patients in the country according to Allergan. I am so grateful to my patients for trusting me. I am also so grateful to my supportive parents, Dr. Tammy Wu, her parents/brothers and to those who have directly helped me grow this new world for me:

Jeannine M, Andrew M, Ken T, Christine Donham Landrum, Jacquie A,Jessica Vargas, Annabeth Ghiglia Allan, Lorena Redula, Katherine Ruth,Karla A Valente, Lynne C, Sarah S, Lea S.

Surgical Artistry Modesto Marathon, Heidi Ryan, Karen Kopecki Hodges Lozano, Vickie Chu-Hermis

Sutter Gould Medical Foundation, McHenry Medical Group (First Choice Physicians), Doctors Medical Center, Memorial Medical Center

Alyssa Petrino, Chris W, Jeran Wadlow, Suleika Bauer, Tadra Rex, Nicholas Eichhorn, Jennifer M, Brooke Cramer, Joe K, Jenny D, Tom Z, Cherise P.,Bree Alexander

Kempton Stephens, Katherine Barton, Paul B, Charles Cherrie Suntra,Enoch Choi

It has been a tremendous first 10 years at Surgical Artistry and I’m looking forward to the next 10.

Number of patients seen per year Calvin Lee - text - Botox


a botox 2015 statistics sign IMG_1370 - 4th version

a botox what we do sign IMG_1370Botox Retention Analysis

cumulative botox 2014 2015 with title

cosmetic acupuncture botox bar graph

quarterly comparison of botox units 2014-2015 - with frame

a shadow IMG_1036 - with text


BOTOX retention rate 2015

1010619_932789926775849_7882059979237310510_n


Our staff was doing some Botox Chart Reviewing, and the Allergan company used those reviews to report that we are better than the national average retention score of 1.8. This means we do a pretty good job of having our patients come back to us for more Botox.

The Botox company does a retention analysis for us from time to time. It’s a measure of how we keep our patients returning to our practice. They have a proprietary method for calculating a score. 4.0 is the best score you can get. I was told before that 1.8 is the average score for all Plastic Surgeons. And we recently scored 3.3. I am very grateful for our returning patients. I guess for now my Botox patients don’t usually leave me and our patients tend to come back! I will continue to try to make it better however I can. Thank you for trusting me with your Botox. It is my passion.


Update on Month of May 2015 Botox Statistics

Botox Statistics per Month (May 2015)

For the entire month of May 2015:
110 patients seen for Botox this month, 28 Patients seen for Juvederm,
121 patients getting Botox OR Juvederm. 17 patients getting Botox AND Juvederm.

Using my own data, I can derive that 35.4 units of Botox is the average number of units per patient.

I know quality counts for much more than quantity. But it is always tempting to look at the numbers provided by the Botox company. This is what you can derive from their computer analysis about my Botox/Juvederm practice. I am also big on injecting Radiesse and Belotero which don’t show up in these numbers.  I’m not sure if these numbers include Juvederm Voluma.  Sometimes Allergan calls Voluma a separate product.

DSC00423 - crop

Botox in Modesto.

More about me, Calvin Lee, Botox injector