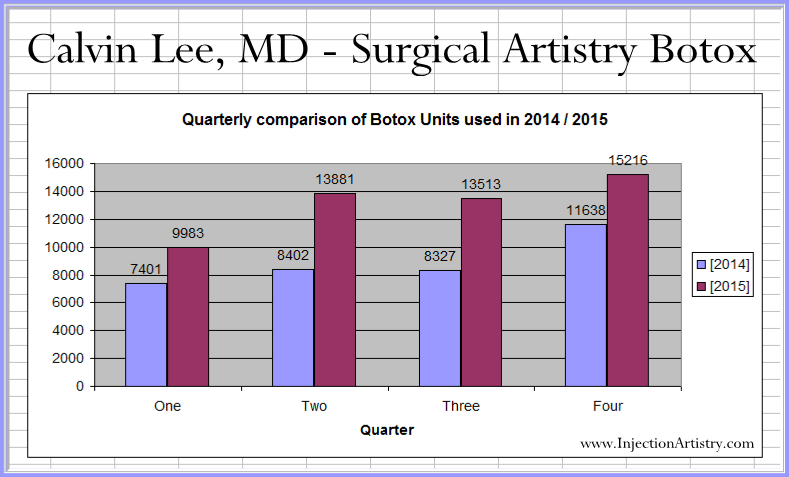
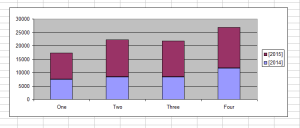
Reflecting upon my own childhood, I think there is an importance regarding summer jobs for kids. I have a life-long enjoyment of working with spreadsheets. My first summer job, which my father gave me at Ciba Geigy (a drug company), involved spreadsheets – using Lotus 1-2-3, I fell in love with the macro programming features, and I remember using spreadsheet programming to make a “pong” type game. I think I was in middle school at the time. I made graphs which were even more sophisticated than what I’m doing now. Anyway, this is today’s spreadsheet data work. I have a ton of numbers and it’s my job to create a way to explain the numbers in a meaningful way. I have numbers that come from each unit of botox used each day at work. And here I can show to my Botox friends that Botox is used the least in Quarter 1, then followed by a Quarter 3. Those are the “relaxed” Botox Quarters of the year. I also like drawing in regression lines, but that will be for another day. I’ve had my spreadsheet fix for today.
In my quest for quality work, I like to study patterns. For me it is always quality over quantity. I don’t like to sacrifice quality for the sake of doing more Botox. But I think the side effect of quality work is that there will be growth.
Quarters 2 and 4 are the strongest quarters for Botox use. Quarters 1 and 3 are weaker with Quarter 1 being the weakest. I’m not entirely sure of the pattern maybe someone can offer me suggestions. It may have something to do with the weather, school cycles, vacation schedules, wedding/reunion deadlines. I’m not sure – or perhaps even with my own scheduling habits. But in the past 2 years, I’ve tried to work as much as possible. I think in the future, I can do a study of “density” of Botox: normalize Botox use per day worked. Ahhh… so much you can do with data.
I have an obsession with spreadsheets, so my wife says. I just have a ton of data and I’m just massaging that data into more meaningful expression. I’m still in the pursuit of higher quality not quantity as some of these graphics suggest. But I’ll see growth as a side effect of successfully upholding the highest values relating to quality.

