Yearly Botox growth measured by the number of people who have had Botox or Juvederm at least once per year at our Modesto Botox Office: Surgical Artistry. 2014 data.
Basically, this is the growth of different patients seen per year at my Botox Practice in Modesto. It doesn’t matter if the patient comes to the office one time for that year for Botox or 100 times. Well, I’ve never really had a patient come to our Modesto office 100 times for Botox.
The numbers come out of a computer program provided by the Allergan company (makers of Botox and Juvederm). The computer program is the analytics part of the Brilliant Distinctions program (BD Analytics). I’m proud of the growth, and very thankful. Half of my time is reserved for Acupuncture and the other half is for cosmetic injectables.
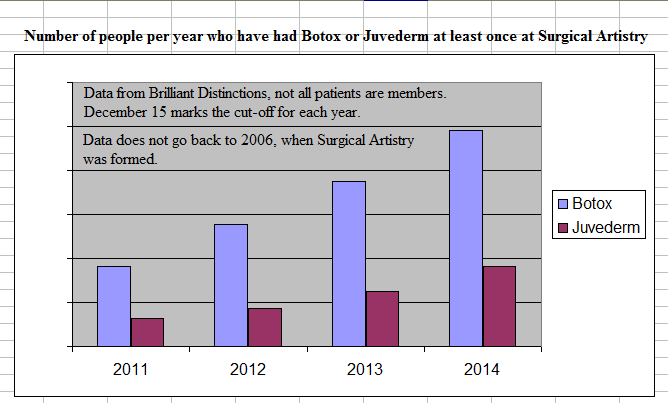
I intentionally left the numbers off the Botox and Juvederm growth chart because I thought they were somewhat distraction. Above is a screen capture of a chart created in Excel.
Notes about the Botox and Juvederm Data:
- The data does not go back to 2006, when Surgical Artistry was formed.
- The cutoff date between the years is December 15.
- A different cutoff date was used in a prior analysis where mid August was the cutoff between the years. That (August to August) shows a greater increase in numbers when looking at the percentage increases for the years 2012 and 2013. The older charts and Botox/Juvederm data is here: Botox and Juvederm Growth 2013.
- Botox growth percentages. 2012: 53.0%, 2013: 35.0%, 2014: 31.6%
- Juvederm growth percentages. 2012: 36.5%, 2013: 44.2%, 2014: 46.8%
www.InjectionArtistry.com (please feel free to visit us in Modesto, CA).